Device Detail
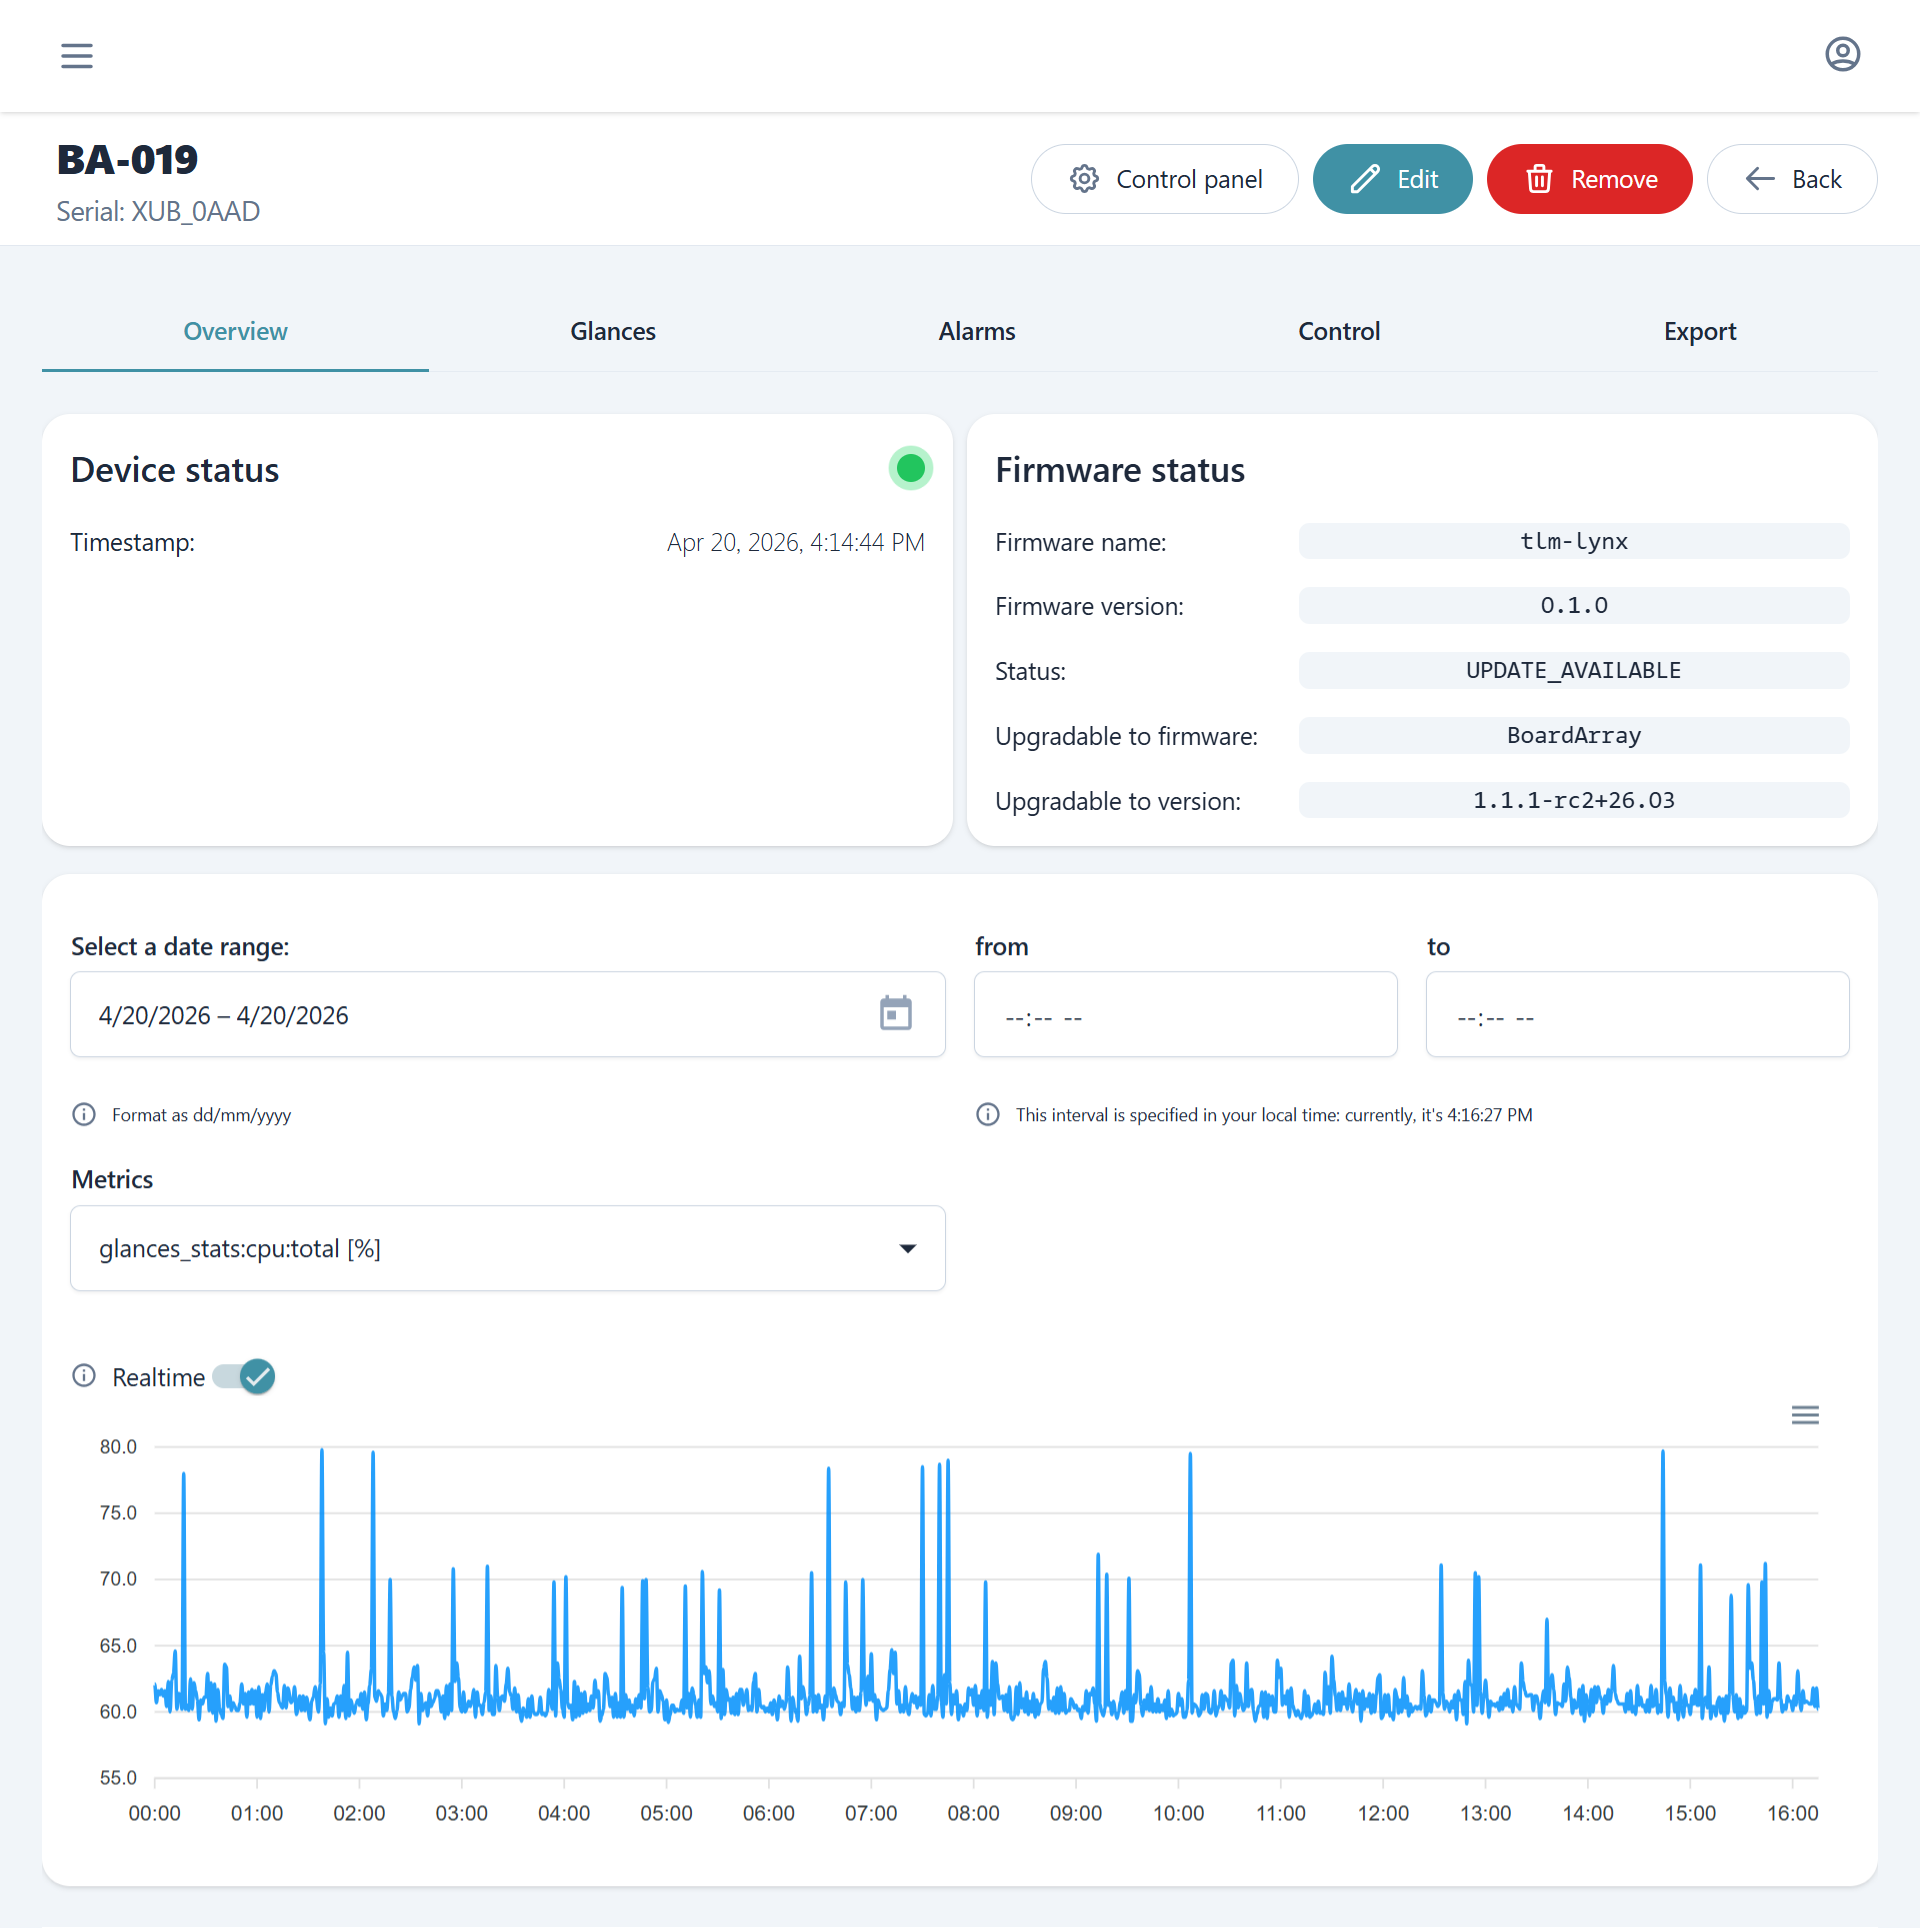
Selecting a device from the device list opens its detail page. The page header shows the device name and serial number along with a set of actions, and the content is organized into tabs, each covering one aspect of the device's live state and history.
| Tab | Content |
|---|---|
| Overview | Connectivity state, firmware and OTA status, and a chart of reported metrics |
| Glances | Historical system status collected by the on-device monitoring agent |
| Alarms | Device-level alarm rules |
| Control | Device terminal and command sending, with channel message history |
| Export | Download of historical telemetry data |
Overview
The Overview tab summarizes the current state of the device through two cards and a metrics chart.
- Device status
- Shows whether the device is online and the timestamp of its last heartbeat. A device is considered online when its last heartbeat was received within the last five minutes.
- Firmware status
- Shows the running firmware name and version and the current OTA update status. When an update is available, the pending firmware name and version are also shown. These values are read from the device's reported information, falling back to its last known status when no recent report is available. See OTA Release for how these states change during an update.
The metrics chart plots the metrics reported by the device. Metrics can be filtered by group, and a realtime toggle streams new values as they arrive.
Glances
The Glances tab charts historical system status collected by the on-device monitoring agent. The available metric groups are:
| Group | Examples |
|---|---|
| CPU | Total, user, system, idle, I/O wait, core count |
| Memory | Total, used, free, available, cached, percent used |
| Swap | Total, used, free, in, out |
| Process count | Running, sleeping, threads, total |
| Load | 1, 5 and 15 minute load averages |
| Uptime | Time since last boot |
As with the Overview chart, metrics can be filtered by group and viewed in realtime.
Alarms
The Alarms tab lists the alarm rules scoped to this device, each shown as a card that can be opened for detail. New alarm rules can be added from here.
Note
For the fleet-wide aggregate of alarm events across all devices, see the Alarms view.
Control
The Control tab is documented separately. See Control.
Export
The Export tab downloads historical telemetry as data files. The exportable nodes mirror the metric groups and metrics shown on the Overview chart, and the data is pulled from the device's event channel.